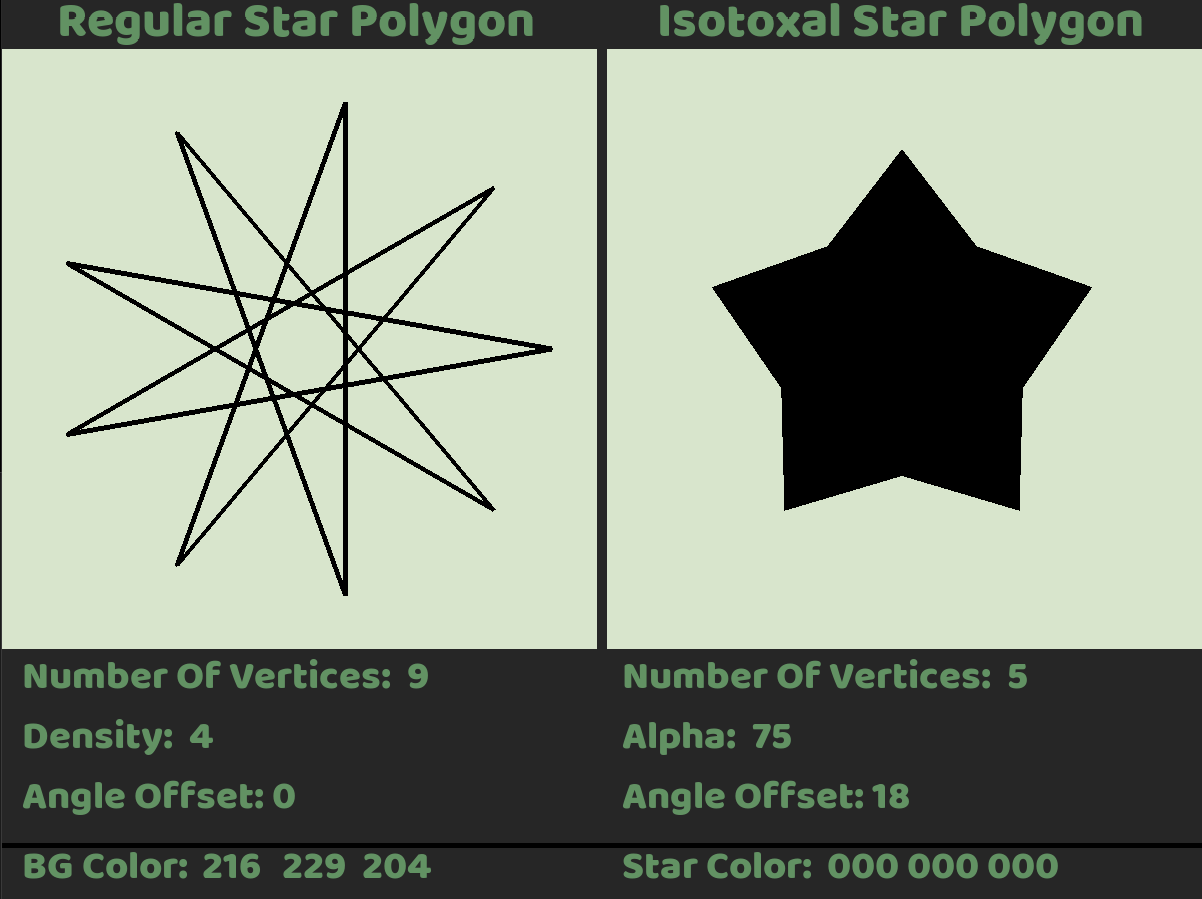
The way to create a regular star polygon is really easy. You have to define {p,q} where p = the number of vertices and q = the density (which can't be lower than 1 nor greater than or equal to p/2).
When p is lower than 5, the density has to be 1. Because we don't just want to draw a point, p also can't be lower than 2.
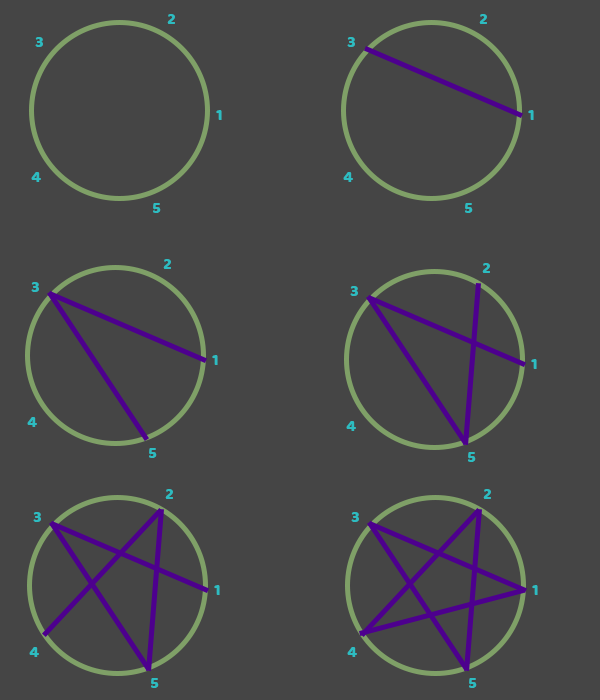
In the example to the right, we will use {5,2} as our variables.
You can think of density like it is a "jump" so to speak.
Firstly we need to map our vertex positions in a circle. You can do this by using the formulae:
"angleIncrement = 360°/p"
"xpos = radius * cos(angleIncrement * currentVertexNumber)"
"ypos = radius * sin(angleIncrement * currentVertexNumber)"
We will start in vertex 1 and we want to connect it to vertex 3. As you might notice 3 - 1 = 2, which is the same as our density.
That is practically how density works.
Once connected to 3, connect 3 to (3 + 2 = 5). 5 is the last vertex, but we still want to keep connecting.
Because 5 is last, you can think of it like number 0, a reset, so now (0 + 2), connect 5 to 2.
(2 + 2 = 4) so connect 2 to 4. ( 4 + 2 = 6) 6 is 1 more than 5, so connect 4 to 1.
It is that simple! You have now successfully created a regular star polygon!
These are a bit more complicated. You need to define {nα}.
Here n is the number of vertices you want, and α will be the degrees for every internal angle of each vertex.
Because this is a special one, n can't be lower than 2 and α has to be bigger than 0° and smaller than 180°.
In the example to the right, we will use {334} as our variables. Yet will just wing the angle when drawing.
This example is the result we want to achieve, yet how do we do that?
Firstly we need to map our vertex positions in a circle again. You can do this by using the same formulae as before:
"angleIncrement = 360°/p"
"xpos = radius * cos(angleIncrement * currentVertexNumber)"
"ypos = radius * sin(angleIncrement * currentVertexNumber)"
This yields us the outer vertices, so far so good.
Now we need to map out the inner vertices, yet we can't do that because we have no inner radius.
To do that we need to use a bit of math.
We will create a triangle inside the figure. ΔCFO in the example.
Calculate angle β by using: "180° - (angleIncrement / 2) - (α / 2)".
Using trigonometry, we can calculate the distance between O and F using:"radius * (sin(α / 2) / sin(β))"
This yields us the distance between the wanted point and the origin. Since all the inner vertices are also located on a circle, this is also our inner radius that we can use!
Now we know how to map the inner vertices out.
This is a bit different however:
"xpos = innerRadius * cos( (angleIncrement / 2) + angleIncrement * currentVertexNumber)"
"ypos = innerRadius * sin( (angleIncrement / 2) + angleIncrement * currentVertexNumber)"
We do the extra "(angleIncrement / 2)" to offset the points.
Now the last task is to connect the dots!
There is no real "jumping" to be made here; follow the circle and connect an outer to an inner vertex, an inner to an outer, and repeat until done. You can even fill it up if you want to!
That was a lot of drawing with math no?
This might be the most random thing to learn about or to even think about.
Yet I had a lot of fun with it!
The reason that I started to delve more into this is simple.
A teacher just asked me to.
Might sound weird but, I respect it.
When working on a lab for Programming 1 in my studies, me and another classmate were done with the exercises.
This was back when we were still learning about the basics; we hadn't even learned arrays back then.
Because the teacher was happy that we were done, he asked us to write some code so we can draw stars just like a pentagram, but make it so the user can specify the amount of vertices.
We didn't know the name for it at the time, but I still accepted the challenge and continued it at home while drinking a nice beer.
I quickly made a shitty program that did work, but was suboptimal since I didn't even understand some code.
We still needed to learn about std::vector<> which was the missing key to a better program.
Now a good 8 months later, I'm finished with my exams and wanted to revisit this project.
I saw some stuff about Isotoxals and wanted to include that aswell.
Lo and behold, the finished program is here.
You can click any of the stars' parameters, this will change the color of the text and you can press numbers; pressing enter will convert the changes.
When a setting is selected and you click anywhere else, no changes will be applied.
To change the colors, you will first be able to change the R value, then the G, then B. Keep in mind that these can't be more than 255
You will see a mini cursor kind off indicating which value you are changing. Pressing enter will make you move on to the next value.
The code is made using a framework that we got from school, which uses SDL.
I quickly made this in the span of a few hours, don't expect this code to be godly. (it might be godly awful)
You can check the code on GitHub here.
You can also just download the program using the download button below.
Keep in mind, do not touch anything and just run the .exe titled "Project1_StarPolygon", deleting anything or moving something might break the program.
If the program still breaks when running the first time, restart the .exe, this might fix it.
If that doesn't fix it, feel free to contact me, it is the first time that I'm releasing an .exe so problems are expected.
The most basic resource has been used to learn about this; Wikipedia.